Annelie Berner
Projects
Courses
Talks & Workshops
Annelie Berner —
Annelie Berner is an interaction designer specialised in data visualisation.

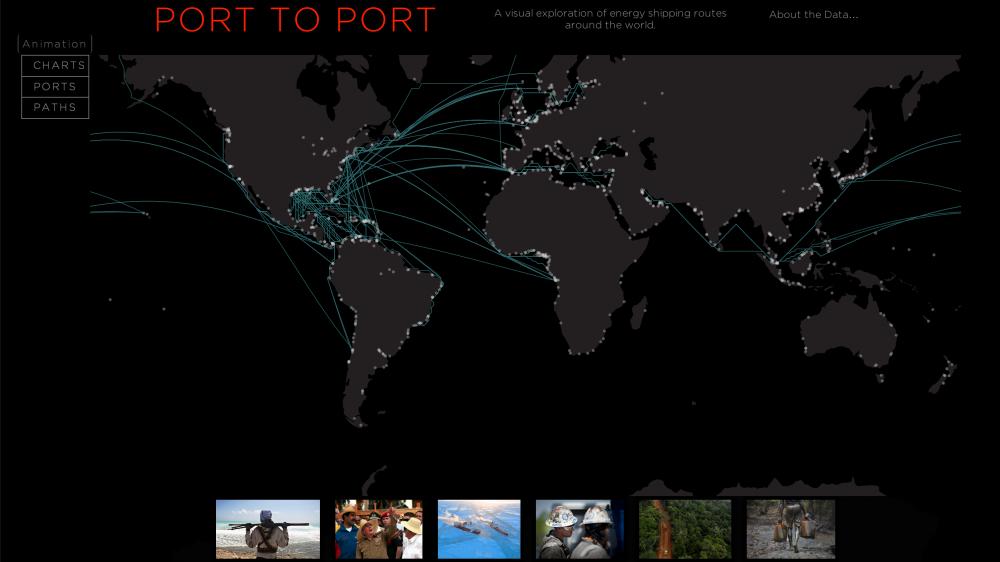
90% of all goods worldwide are moved by ship, but shipping is mostly invisible. More than 300 million Metric Tons of energy are shipped in and out of the United States each year, in 60,000 shipments.
This project presents the ports and paths of the 2.7 billion Metric Tons of energy shipped through more than 90 US ports from 2002 - 2012.
Using data assembled by Thomson Reuters, Port to Port maps global oil shipping routes as well as other forms of energy navigating ocean territories to and from the United States.
Using D3 as an interactive web platform we designed a map interface that is scaled globally while embedded with local stories about energy movement from port to port. Data can be viewed across time, which reveal changes in patterns of movement as the geopolitics, price of oil, and conditions at specific ports change.
In collaboration with Thomson Reuters Research Unit.
Project link:
Port to Port
Project Team
Project director: Laura Kurgan
Data analysis and data visualization: Juan Francisco Saldarriaga
Design development and D3 interface: Annelie Berner and Scott Murray